Creating custom log types
Log Viewer allows you to create additional log processors. This does require some knowledge with Regular Expressions. RegExr is a great place to practice, learn, and validate your regular expressions.
First, create a new Log class that extends the Opcodes\LogViewer\Logs\Log class, and give it a name.
use Opcodes\LogViewer\Logs\Log;

class CronLog extends Log
{
    public static string $name = 'Cron';

    //
}
Next, define the RegEx pattern that would match a single log entry. It should include named capture groups for any data points you want to extract. By default, it expectsdatetime, level and message named capture groups.
For example, assume that a single Cron log entry looks like this:
Jul 31 06:25:01 mycomputer CRON[12345]: (root) CMD (command -option argument > /dev/null 2>&1)
We can extract the datetime, host (mycomputer), the type CRON, process ID (12345), the user running the cron task (root) and the actual command, which we'll treat as the message of the log (CMD (command -option argument > /dev/null 2>&1)).
To do this, let's add the follow $regex static property:
use Opcodes\LogViewer\Logs\Log;

class CronLog extends Log
{
    public static string $name = 'Cron';

    public static string $regex = '/^(?<datetime>\S+[\s\d:]+) (?<hostname>\S+) (?<type>.*)\[(?<pid>\d+)\]: ?(\((?<user>\S+)\))? (?<message>.*)/';
}
Here is a link to the Regular Expression above and a few example log entries that I have tested on RegExr.
Next, define a fillMatches(array $matches = []) method, which would receive a list of matches from the regex, and you would use these to fill in the properties of the Log class.
use Opcodes\LogViewer\Logs\Log;

class CronLog extends Log
{
    public static string $regex = '/^(?<datetime>\S+[\s\d:]+) (?<hostname>\S+) (?<type>[^\[\]]+)\[(?<pid>\d+)\]: \((?<user>\S+)\) (?<message>.*)/';

    public function fillMatches(array $matches = []): void
    {
        // The parent class already handles the "datetime", "level" and "message" matches. But you're free to assign them yourself.
        // If you added custom regex named groups, you'll have to assign them to the `$this->context` array below.
        parent::fillMatches($matches);

        $this->context = [
            'hostname' => $matches['hostname'],
            'type' => $matches['type'],
            'user' => $matches['user'],
            'pid' => $matches['pid'],
        ];
    }
}
And finally, register the new log type with any identifier of your choice in the AppServiceProvider:
use Opcodes\LogViewer\Facades\LogViewer;

/**
 * Bootstrap any application services.
 *
 * @return void
 */
public function boot()
{
    LogViewer::extend('cron', CronLog::class);
}
And that's it! You should now see cron logs in your Log Viewer UI, provided that you have also added the file paths to includes_paths configuration option in config/log-viewer.php.
Next, let's learn how configure the different severity levels found within these logs.
Custom log severity levels
Some types of logs have different levels of severity. Some, like Laravel logs, might have info, debug, warning, error and other similar severity levels. Meanwhile, Horizon logs don't have severities, but instead statuses such as Running, Done or Fail. For Apache/Nginx access logs, for example, we have chosen the status code of the response to represent the severity.
In order for Log Viewer to understand the different severity levels (or statuses, or whatever you want to represent how important that log entry is), you can define your own Log Level class.
use Opcodes\LogViewer\LogLevels\LevelInterface;
use Opcodes\LogViewer\LogLevels\LevelClass;

class CustomLevel implements LevelInterface
{
    // ...

    public function getName(): string
    {
        return ucfirst($this->value);
    }

    public function getClass(): LevelClass
    {
        return match ($this->value) {
            self::Debug   => LevelClass::info(),
            self::Warning => LevelClass::warning(),
            self::Error   => LevelClass::danger(),
            default       => LevelClass::none(),
        };
    }
}
The getClass() method should return a LevelClass instance, which determines the colour of the log in the front-end (success, info, warning, danger or none).
Once the level class is defined, you can relate it to a Log class by setting the $logClass static property:
class CronLog extends Log
{
    public static string $levelClass = CustomLevel::class;

    // ...
}
Customising the columns displayed in the UI
Log Viewer now allows to choose what data is visible in the Log Viewer table of logs. By default, it displays the datetime, severity, and the message. Various built-in log types will sometimes have a different setup.
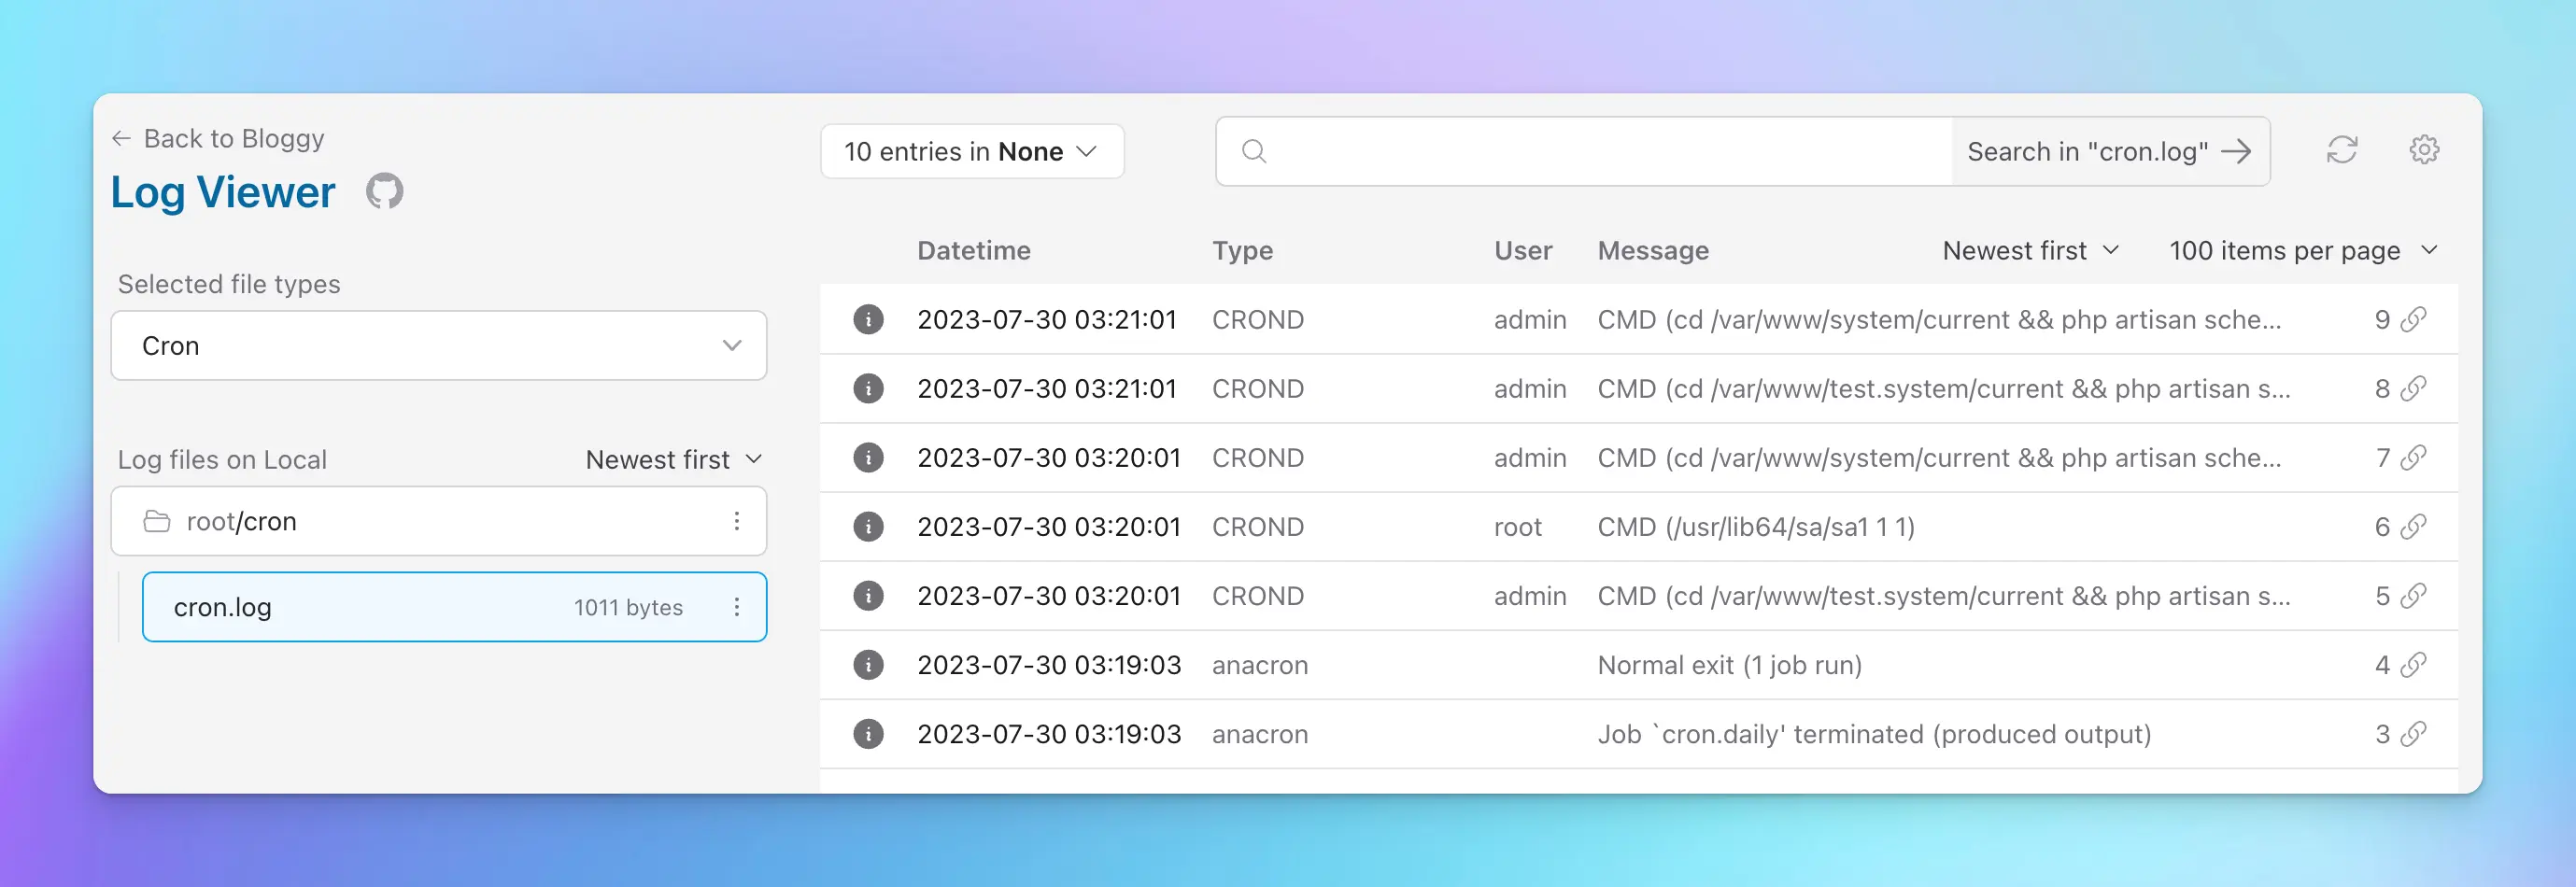
To customise the columns displayed, add a static $columns property on the log class. Notice how the data_path uses the dot-notation for any nested properties.
class CronLog extends Log
{
    // ...

    /** @var array|\string[][] The columns displayed on the frontend, and which data they should display */
    public static array $columns = [
        ['label' => 'Datetime', 'data_path' => 'datetime'],
        ['label' => 'Type', 'data_path' => 'context.type'],
        ['label' => 'User', 'data_path' => 'context.user'],
        ['label' => 'Message', 'data_path' => 'message'],
    ];

    // ...
}
In the example above, we don't display the level property which usually is displayed, because we simply don't have it in our Cron logs. Instead, we will display the type and user who ran the Cron command.